
Exploring Tucson's Commercial Properties: What Investors Need to Know in 2026
Tucson commercial properties sit within a metro area of roughly 1,070,000 residents as of 2024, according to U.S. Census Bureau estimates. That expanding base, coupled with steady job gains in logistics, aerospace, and higher education, continues to draw regional and out-of-state investors. In 2026, attention focuses on how limited new supply, shifting office demand, and strong industrial absorption along corridors like Interstate 10 and South Palo Verde Road will influence pricing, cap rates, and long-term performance across key Tucson submarkets.
How is Tucson's commercial property market positioned going into 2026?
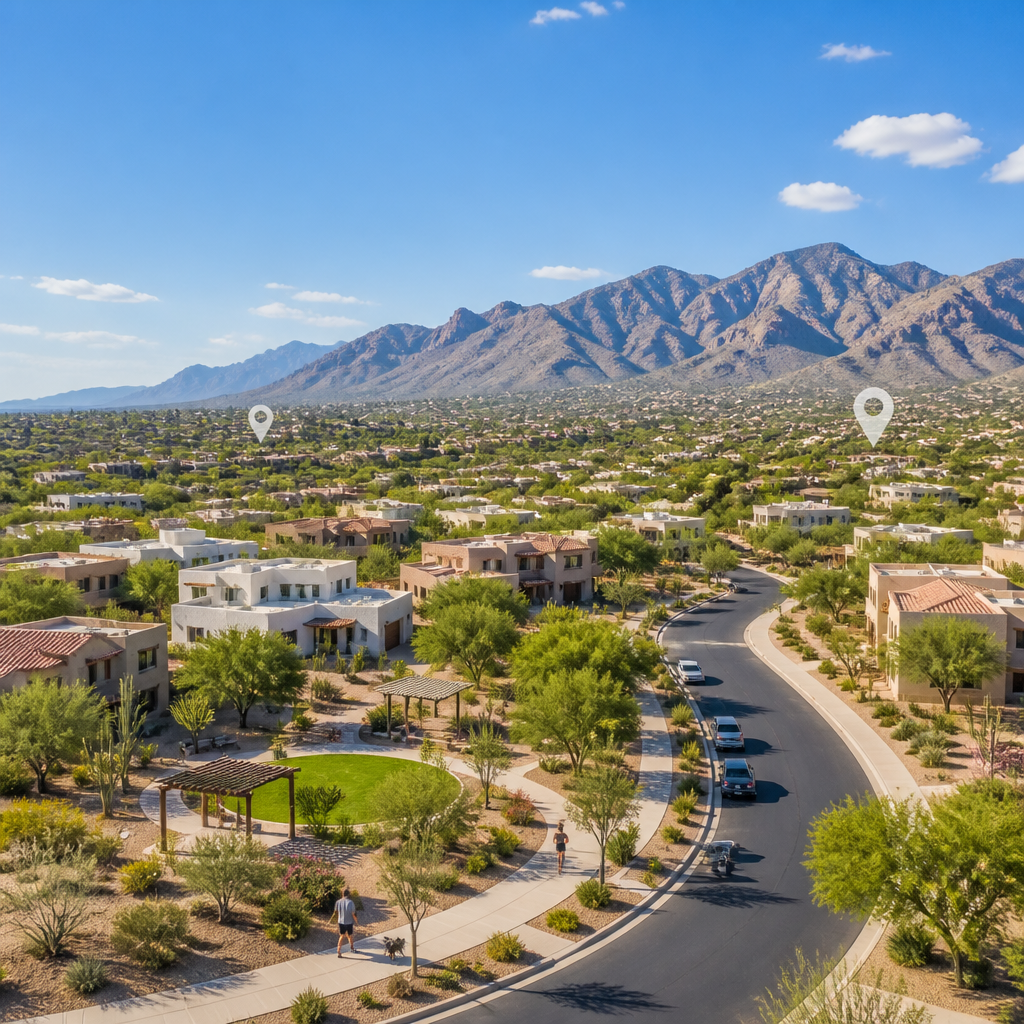
Tucson’s commercial inventory covers office, retail, industrial, and mixed-use assets from Downtown Tucson to Oro Valley and Marana. According to CBRE Tucson, metro industrial vacancies have hovered in the tight range of 3% to 5% in recent quarters, reflecting strong logistics and manufacturing demand. Office vacancies remain higher, in the approximate band of 15% to 18%, as employers recalibrate hybrid work strategies. Retail strip centers along Broadway Boulevard and Speedway Boulevard show healthier occupancy, supported by daily-needs tenants and sustained neighborhood traffic.
Price points vary widely by asset class. Based on listings tracked by LoopNet, stabilized neighborhood retail centers can trade between roughly $2.4M and $6.5M, while smaller single-tenant net-lease assets sometimes fall in the $1.2M to $2.0M band. Industrial buildings near Tucson International Airport, particularly along Valencia Road and South Nogales Highway, command premium pricing because of proximity to air cargo infrastructure and Interstate 19. That diversity gives investors multiple entry points, from value-add strip centers to institutional-grade logistics facilities.
Cap rates also show stratification across Tucson commercial properties. According to recent Southwest reports by CoStar, core industrial assets in strong logistics nodes often trade in a range of roughly 5.5% to 6.5%, while stabilized multi-tenant retail can sit closer to 6.5% to 7.5%. Older office properties on Grant Road or Oracle Road with significant lease-up risk may require cap rates in the 8% range or higher to attract capital. These spreads underscore the importance of detailed underwriting in 2026.
Late afternoon in Downtown Tucson, the brick facades along Congress Street catch a warm amber glow as the sun drops behind Sentinel Peak. The subtle vibration of the Sun Link streetcar rolling past the Rialto Theatre mixes with music drifting from Club Congress and the aroma of roasted coffee from Cartel Coffee Lab. Investors touring upper-floor offices above Hotel Congress can hear conversation from sidewalk patios along North Toole Avenue, giving each building a tangible sense of tenant energy and nighttime foot traffic.
Which Tucson submarkets and corridors matter most for commercial investors?
Several corridors dominate attention for Tucson commercial properties. The Downtown core around Congress Street, Broadway Boulevard, and the Tucson Convention Center offers office, retail, and hospitality opportunities tied to events and tourism. The University of Arizona campus along East University Boulevard and Speedway Boulevard anchors student housing, research facilities, and street-level retail. According to Visit Tucson, the region hosts over 7 million annual visitors, supporting hotels, restaurants, and entertainment venues from Fourth Avenue to Main Gate Square.
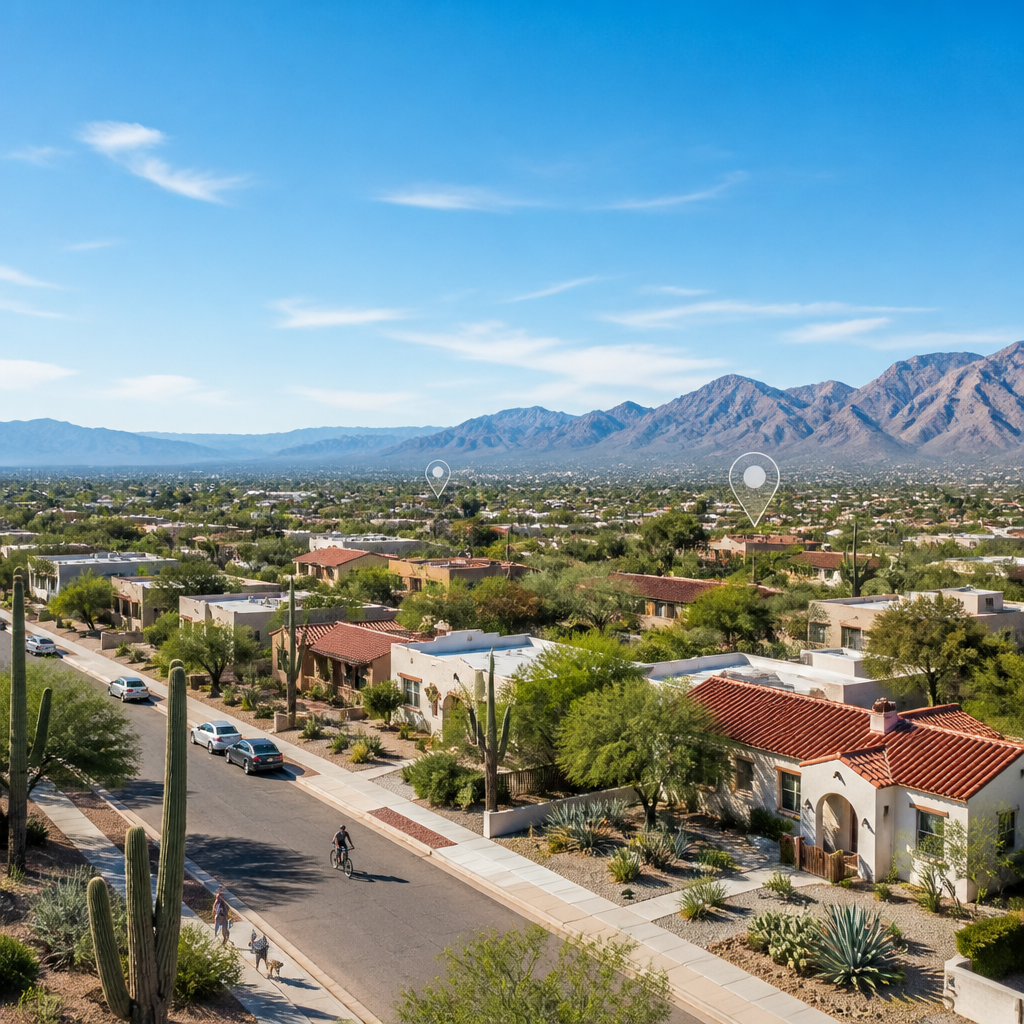
The northwest corridor, including Oro Valley and areas near Oracle Road and Tangerine Road, has seen increasing medical and office development. Banner–University Medical Center and Northwest Medical Center drive healthcare demand, while Class A offices along La Cholla Boulevard and Lambert Lane attract professional tenants. In Marana, industrial parks near the intersection of Interstate 10 and Cortaro Road benefit from direct freeway exposure. Reports from City of Tucson Economic Initiatives highlight logistics and advanced manufacturing as priority growth sectors in these nodes.
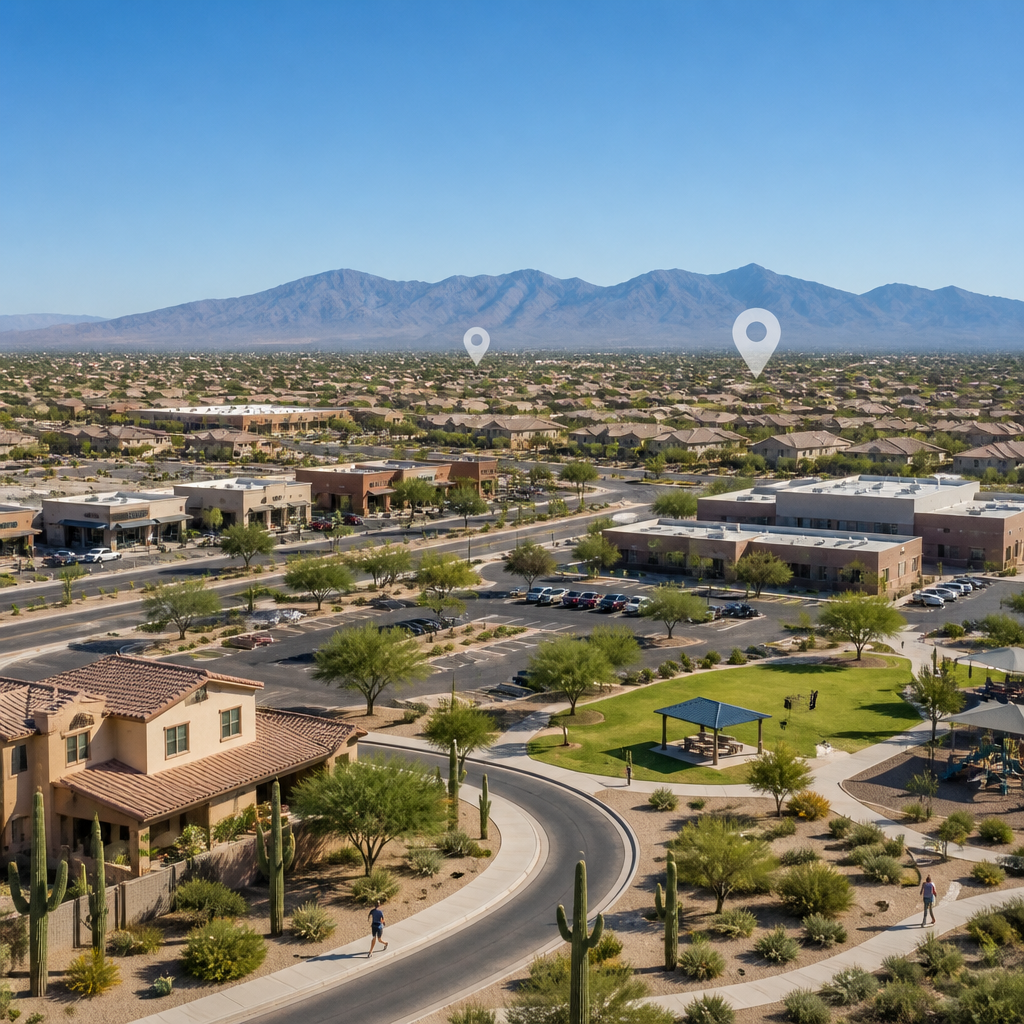
Retail-focused investors often examine Park Place Mall on East Broadway Boulevard and Tucson Mall near North Oracle Road as anchors for surrounding strip centers. Pads along East Grant Road, East Speedway Boulevard, and East Broadway support quick-service restaurants, auto service, and medical office users who value traffic counts exceeding 30,000 vehicles per day on key segments, based on traffic maps from Arizona Department of Transportation. Neighborhood centers near Reid Park, Himmel Park, and Udall Park frequently capture stable daily-spend tenants such as grocers, pharmacies, and fitness concepts.
Around sunset in the Mercado District near Avenida del Convento, string lights above the courtyard at Mercado San Agustín flicker on as the sky shifts from blue to deep violet. The smell of grilled carne asada from Seis Kitchen mingles with sweet baked aromas drifting from La Estrella Bakery. Guitar music and low conversation echo against the stucco arcades, while the modern streetcar glides past the MSA Annex shipping-container shops. The tactile blend of historic textures and new construction gives mixed-use projects an intimate, experiential appeal.
What should investors know about rents, vacancies, and operating costs?
Rental rates across Tucson commercial properties show clear segmentation. According to CBRE Tucson, Class A office space in core locations often achieves asking rents between roughly $26 and $32 per square foot, full-service. Older Class B buildings along East Broadway Boulevard or Grant Road might post rates closer to $18 to $23. Industrial rents, quoted on a triple-net basis, typically fall around $9 to $12 per square foot for newer distribution space near Tucson International Airport and the Port of Tucson rail hub.
Retail rents depend heavily on visibility and co-tenancy. Data tracked by LoopNet suggests inline shop space in successful grocery-anchored centers frequently commands $22 to $30 per square foot, while second-generation spaces in older centers along South Sixth Avenue or South 12th Avenue may settle in the mid-teens. Vacancy for well-located strip centers near popular destinations such as El Con Center, Reid Park Zoo, and Sabino Canyon Recreation Area often remains below 7%, supporting stable cash flow assumptions for long-term holds.
Operating expenses reflect Tucson’s tax and utility structure. According to property tax data summarized by Pima County, effective commercial property tax rates often land in the approximate range of 0.8% to 1.2% of assessed value, though specific bills vary by parcel and assessment ratio. Owners of office and retail assets frequently budget combined expenses of $7 to $10 per square foot for taxes, insurance, and common-area maintenance, while industrial parks with simpler site plans can run slightly lower on a per-square-foot basis.
Lease structures also warrant careful analysis. Many industrial and retail assets across Tucson use triple-net formats, shifting taxes, insurance, and maintenance to tenants and reducing expense volatility for owners. Office leases may range from full-service gross in Class A towers near the Tucson Convention Center to modified gross arrangements in mid-rise buildings on North Campbell Avenue or North Swan Road. Understanding whether expense stops reset annually and how management allocates utilities materially influences net operating income projections in 2026 underwriting models.
How do Tucson demographics, employment, and education support commercial demand?
Population growth and employment trends underpin demand for Tucson commercial properties. According to labor statistics from the U.S. Bureau of Labor Statistics, the Tucson metro has recorded job growth in the approximate range of 1.5% to 2.5% annually in recent years, led by sectors such as education, healthcare, and logistics. Major employers include Raytheon Missiles & Defense near South Kolb Road, the University of Arizona near Speedway Boulevard, and Davis-Monthan Air Force Base southeast of the city center.
The University of Arizona’s student body, which exceeds 48,000 students and staff according to University of Arizona data, drives ongoing demand for retail, food service, and housing along University Boulevard, North Park Avenue, and Fourth Avenue. Pima Community College’s Desert Vista and Downtown campuses add further educational presence. This concentration of higher education supports lab space, small-office users, and service businesses in surrounding neighborhoods from West Speedway Boulevard to North Stone Avenue.
Tourism and retiree migration add additional layers of demand. Visit Tucson notes that visitor spending in the region exceeds $2 billion annually, supporting hotels around the Tucson Convention Center, casino properties near Valencia Road, and resorts in the Catalina Foothills near North Campbell Avenue and Sunrise Drive. Active adult communities on the city’s northwest side feed medical office demand along La Cañada Drive and Oracle Road, while seasonal residents amplify winter activity in restaurants, golf facilities, and retail centers near Omni Tucson National Resort and La Encantada.
Household income and lifestyle preferences also shape performance. Neighborhoods near Sabino Canyon, Saguaro National Park East, and Ventana Canyon tend to show higher median incomes, supporting specialty retail and boutique office concepts. In contrast, corridors along South Sixth Avenue and South 12th Avenue emphasize local restaurants, auto services, and discount retailers, with lower average rents but strong local loyalty. Aligning tenant mixes with these demographic nuances helps owners maintain occupancy, manage rollover risk, and calibrate improvement budgets across different Tucson submarkets.
What strategies can investors use to evaluate Tucson commercial properties in 2026?
Thorough evaluation of Tucson commercial properties in 2026 starts with data-driven submarket analysis. Investors frequently compare recent sales and leasing activity across corridors like Broadway Boulevard, Grant Road, and Oracle Road to establish realistic rent and vacancy assumptions. Reports from CoStar and CBRE help quantify average deal sizes, tenant retention, and absorption trends. Combining these metrics with site-level observations around traffic counts, nearby anchors such as Tucson Mall or Park Place Mall, and access to Interstates 10 and 19 refines underwriting accuracy.
Physical condition and adaptability matter as much as location. Older centers near Midtown, around Alvernon Way and Speedway Boulevard, may require façade upgrades, parking lot resurfacing, or energy-efficiency improvements to attract higher-credit tenants. Industrial buildings along South Palo Verde Road and South Wilmot Road benefit from clear-height ceilings, dock configurations, and yard space that support modern distribution operations. Investors frequently budget capital reserves equal to 10% to 15% of purchase price over the first few years for repositioning, based on renovation benchmarks compiled by CBRE Research.
Leasing risk analysis remains essential. Properties with near-term rollover concentrated within 24 to 36 months may demand higher going-in cap rates or structured reserves to offset downtime. Detailed review of rent rolls on assets near Banner–University Medical Center, Reid Park, and the Rillito River Park trail system helps identify below-market leases, percentage-rent clauses, and options that affect long-term value. Sensitivity testing for rental-rate growth of 1%, 2%, and 3% annually offers a framework for evaluating resilience under different economic scenarios.
Local partnerships often enhance outcomes. Collaborating with Tucson-based property managers, leasing brokers, and contractors familiar with neighborhoods such as Sam Hughes, Armory Park, and Rincon Heights provides granular insight into tenant demand and operating norms. Attention to emerging districts—like revitalization around North Stone Avenue or infill projects near the modern streetcar line—can reveal opportunities ahead of broad institutional interest. Balancing hard data, on-the-ground observation, and conservative underwriting positions investors to capitalize on Tucson’s evolving commercial landscape in 2026 and beyond.
The 1,070,000 metro population figure cited at the start of this guide reflects the structural demand base that underpins Tucson commercial properties. That population scale, combined with steady job and visitor growth, underscores why incremental shifts in vacancy or rent levels can materially influence long-term returns. The Tucson Association of Realtors commercial market updates provide a central reference point for tracking submarket performance and new development pipelines. Investors who register listing alerts and commit to touring qualified properties within 48 hours of availability ahead of the spring leasing surge in March and April position portfolios to capture stronger credits, while delayed engagement during that window typically results in reduced tenant choice and higher concession requirements.
FROM OUR BLOG
Moving to Tucson, AZ: Essential Tips for New Residents in 2026
Moving to Tucson, AZ: Essential Tips for New Residents in 2026 Tucson combines desert scenery, a major research university, and relatively moderate living costs, which continues to draw new residents each year. According to the U.S. Census Bureau, Tucson’s population exceeds 545,000 residents, with
Top Investment Properties in Marana, AZ: A Comprehensive Guide for 2026
Top Investment Properties in Marana, AZ: A Comprehensive Guide for 2026 Marana continues to rank among Pima County’s fastest-growing corridors, with population increasing roughly 19% between 2010 and 2020, according to U.S. Census Bureau estimates. That growth, coupled with expanding employment arou